
Usage Based Reporting for Usage-Based Pricing
My Role
Sole product designer supporting the first iteration of a new admin feature for a no-code app development platform used by enterprise clients.
Context
The platform was transitioning to usage-based billing.
Depending on the needs of an application (API calls, data storage, etc.), it would require a certain amount of “tokens” to run.
To support adoption, we needed to communicate this change within the platform for existing clients.
The Problem
Business users needed a way to track token usage for their production environments.
The core design challenge was deciding what we could show without creating false confidence or mistrust in a process that was still maturing.
What I Worked On
I partnered closely with Engineers and DevOps to help define a shippable MVP.
My focus was on:
Clarifying user needs across business and technical stakeholders
Surfacing trade-offs early
Constraining scope to reliable signals that could ship
Key Decisions
Narrowed the MVP to business users focused on planning and budgeting
Avoided granular breakdowns that looked precise but weren’t reliable
Designed around trends, remaining capacity, and planning signals not diagnostics
Treated alerts and deeper diagnostics as fast follows once infrastructure matured
Outcome
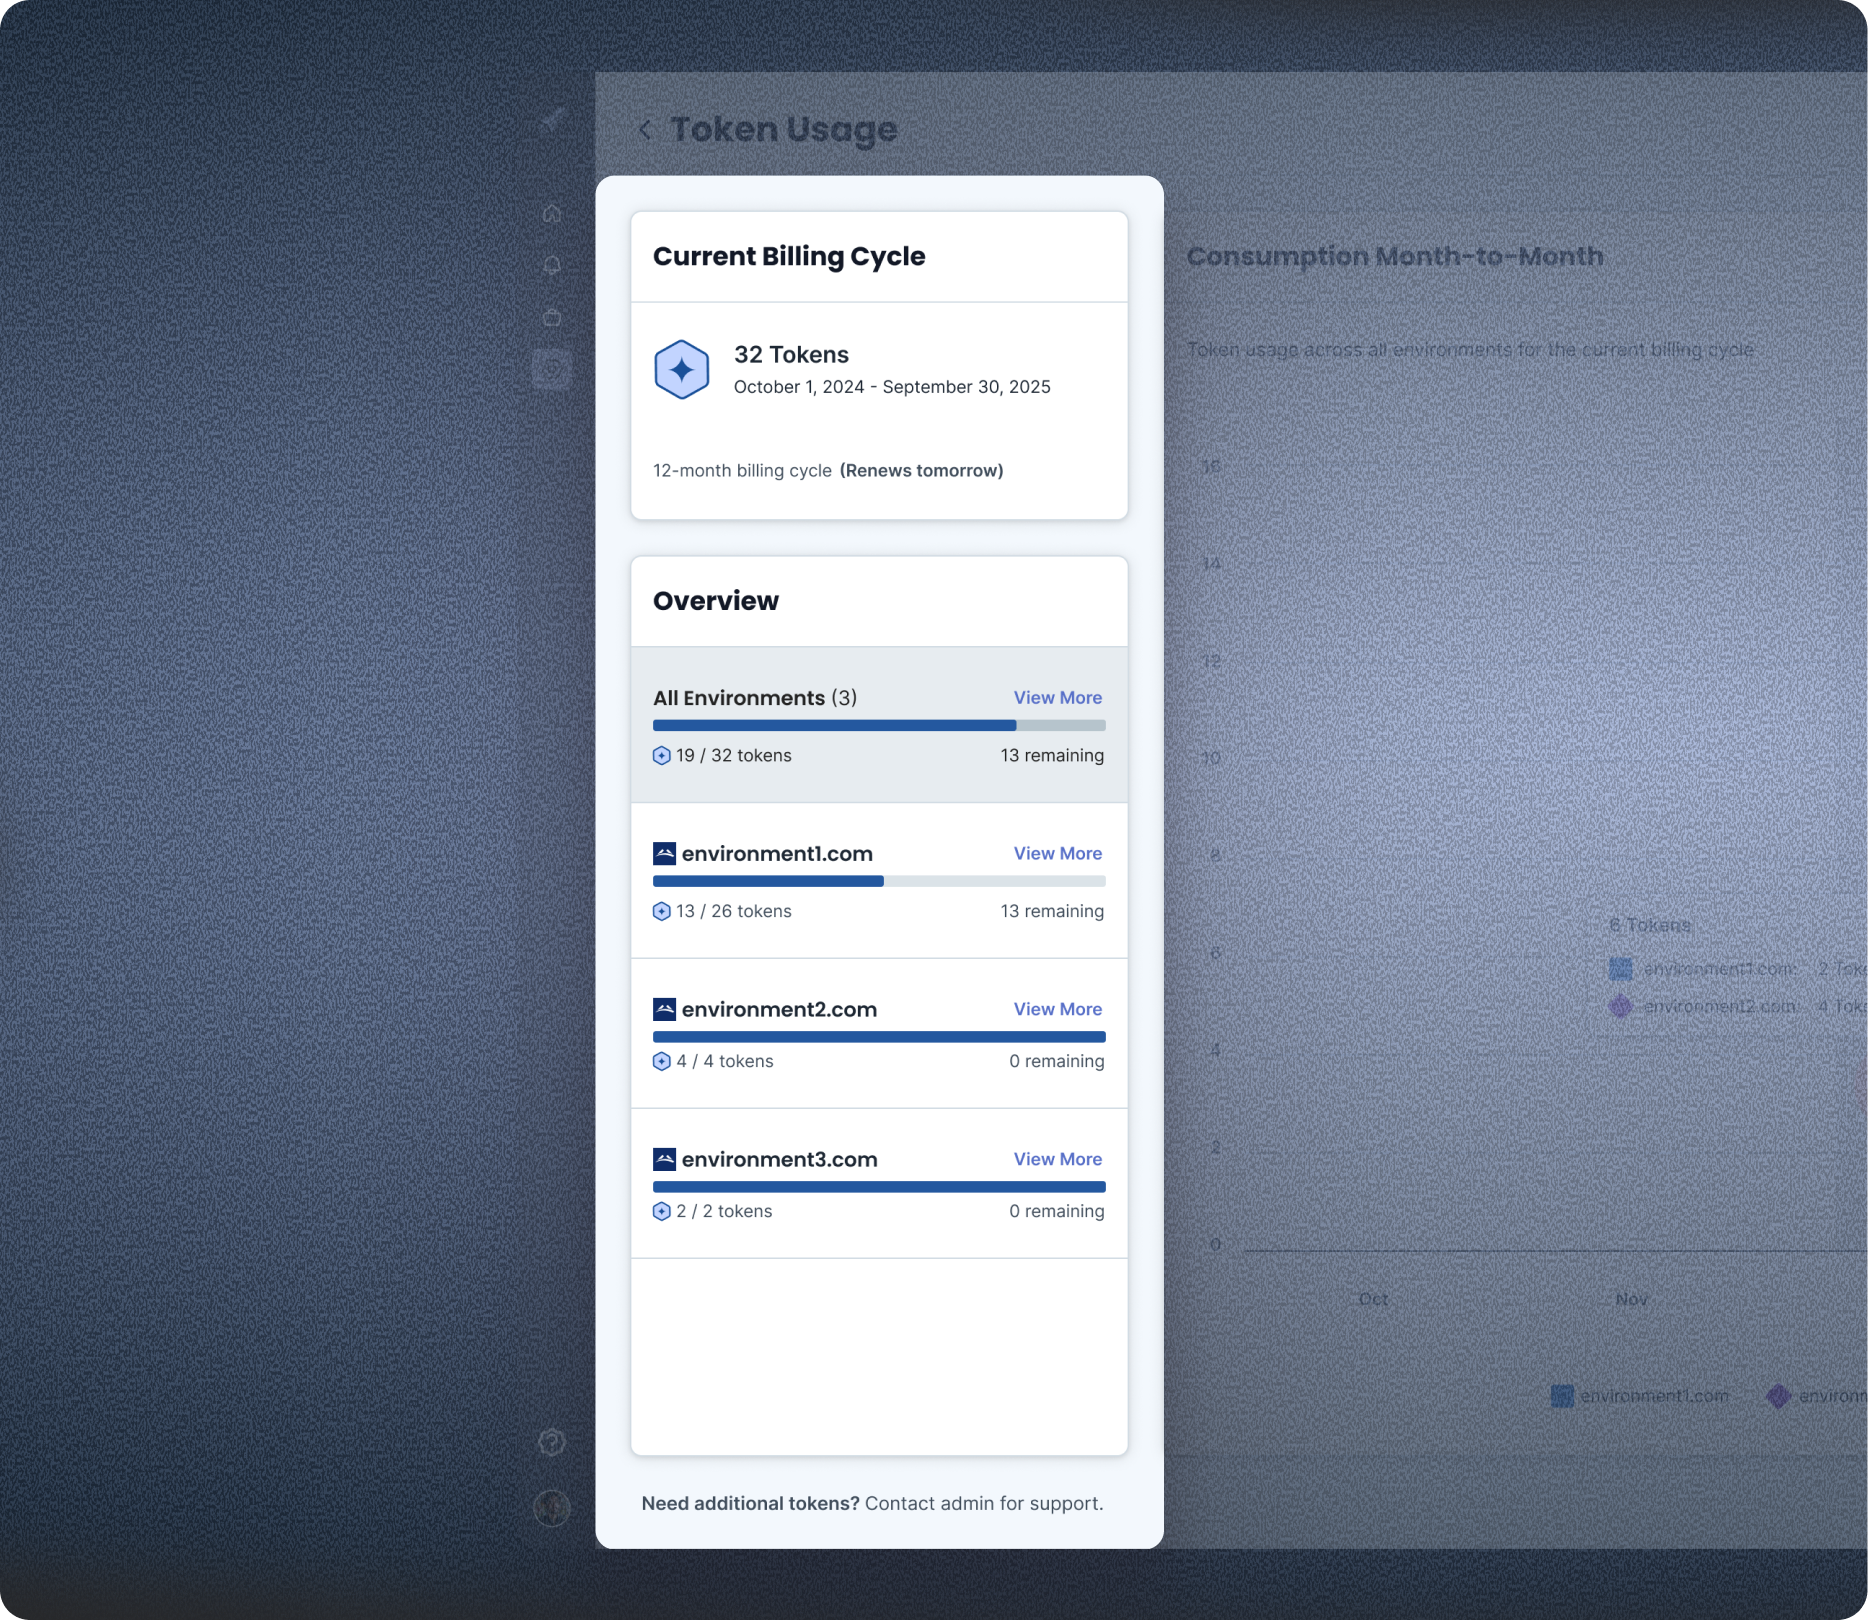
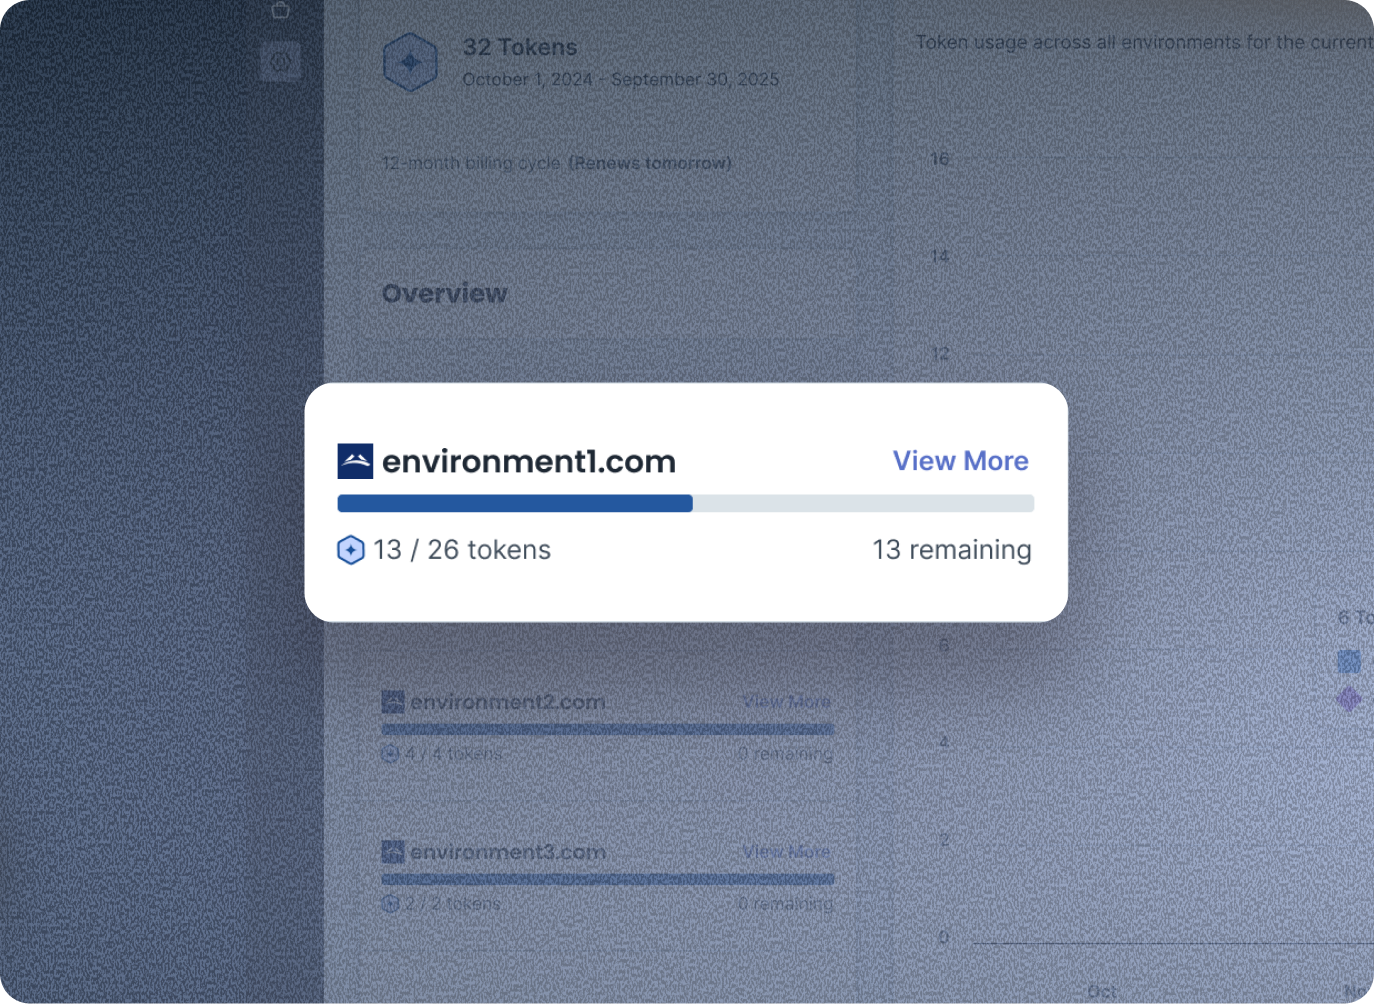
The result was a token usage dashboard that:
Centralized usage visibility in the admin experience
Helped business users answer “Am I on track?” and “Where should I pay attention?”
Reduced risk in adopting a new pricing model
Established a scalable foundation for future iterations
